
ReportEarth chart archive
Since I began this Substack in March 2025, I've been making lots of charts. Now they can all live in one place.

This page was last updated on 4/16/2026.
ReportEarth publishes a lot of charts, usually using the excellent Datawrapper tool to ensure that they look reasonably good on desktop, mobile, and in emails. Indeed, as of April 15, 2026, I’ve published 43 of them!
This URL is an attempt to create an archive of these. Eventually, I may need to break this into multiple pages as it grows. We’ll see.
Those charts published with Datawrapper are all sharable: Just click on the word “Datawrapper” in each to get its URL.
I struggled with how to organize these, and for now have decided on a two tier system. The charts that have been recently updated appear at the top, and are in their own category. These tend to feature monthly data or, in one case so far, daily data.
Below these, the charts that have not been recently updated are organized by topic. Many of these feature annual data, or data that just isn’t being updated regularly or at all (data found in a single published scientific study, for instance). Or, these charts represent cases in which updating is possible, but I just haven’t gotten around to doing it yet for some reason.
Stepping back: I’m constantly trying to find new ways to visualize data, and I’m very open to trying out different geoms and other approaches. So these visualizations may evolve, and their numbers will certainly grow.
First, just scroll down for charts that have been recently updated.
For charts that were not recently updated, organized by topic, you can click the following links:
Arctic | Antarctic | Glaciers and Ice Sheets | Global Temperatures | Greenhouse Gas Emissions | Historic Temperature Records | Newspapers and Communications | Sea Level Rise | Science | Story visualizations | U.S. Temperatures | Water | Wildfires
Recently updated
This chart was first added to this page on 8/22/2025. It was updated through March 2026 on 4/10/2026.
This chart was originally published on May 12, 2025. That version was published in Datawrapper. This newer version was created in R and added to this page on 4/10/2026.
This chart was originally published on 2/7/2026. It was updated with March 2026 data on 4/16/2026.
This chart was originally published on September 26, 2025, in a format that used calendar dates, rather than numeric days of the year, on the horizontal axis. I have since changed to the latter approach. This chart will not be updated daily, but may be updated at key moments for sea ice in either hemisphere. It was most recently updated on March 26, 2026.
This chart was originally published on June 14, 2025. It was last updated with February 2026 figures in early April 2026.
This chart was originally published on March 14, 2025. It was last updated with February 2026 figures in early April 2026.
This chart was originally published on July 17, 2025. It is currently up to date (as of 2/11/2026).
This chart was originally published on May 23, 2025, and was updated with data through December 2025 on 3/24/2026.
Arctic
This chart was originally published on July 17, 2025. It was updated on 1/16/2026 with annual data for the year 2025.
This chart was originally published on 10/23/2025. I will consider updating it as more data become available (as of 10/26/2025).
This chart was originally published on July 17, 2025. Because it visualizes data from a published scientific study, there is no plan to update it (as of 8/3/2025).
Antarctic
This chart was originally published on May 23, 2025, and updated in March 2026, with the value for February 2026.
Glaciers and Ice Sheets
This chart was originally published on March 28, 2025 and has not been updated (as of 8/3/2025). However, if there is a new release from the GlaMBIE team, I may do so.
This chart was originally published on July 3, 2025. Because it visualizes data from a single scientific study, there is no plan to update it (as of 8/3/2025).
This chart was originally published on March 28, 2025 and has not been updated. I will consider updating it if there is a new release of data from the GlaMBIE and/or IMBIE projects (as of 8/3/2025).
Global Temperatures
All charts recently updated at present (4/10/2026).
Greenhouse Gas Emissions
This chart was originally published on May 12, 2025. It was updated with 2025 figures on November 13, 2025.
This chart was originally published on June 22, 2025, and has not been updated (as of 8/3/2025).
Historic Temperature Records
This chart was published on 1/2/2026. I will endeavor to update it annually with new data.
This chart was published on 1/2/2026. I have no current plans to update it.
Newspapers and Communications
This chart was originally published on June 14, 2025. It was updated with October 2025 figures on 11/19/2025.
This chart was originally published on June 14, 2025. Because it is based on data from a published research paper, I do not plan to update it (as of 8/3/2025).
This chart was originally published on June 14, 2025. I may consider updating it upon publication of a new data journalism survey, but there is currently nothing to add (as of 8/3/2025).
This chart was originally published on June 14, 2025. Because it is based on data from a published scientific study, there is no plan to update it (as of 8/3/2025).
This chart was originally published on September 5, 2025. I will endeavor to update it going forward.
This chart was originally published on September 5, 2025. I will endeavor to update it going forward.
Sea Level Rise
This chart was originally published on June 22, 2025. I will consider updating it as new data become available (as of 8/3/2025).
This chart was originally published on 10/26/2025. It was most recently updated with data through December 2025 on March 24, 2026.
This chart was first published on September 28, 2025. I will update it when full 2025 data are available.
This chart was first published on September 28, 2025. I will update it when full 2025 data are available.
Kiptopeke sequence of sea level charts from this story:
This chart was originally published on 2/11/2026. There are no current plans to update it.
This chart was originally published on 2/11/2026. There are no current plans to update it.
This chart was originally published on 2/11/2026. There are no current plans to update it.
Science
This chart was originally published on March 21, 2025 and has not been updated. The available National Science Foundation data only run through the year 2022, but more recent data may be available elsewhere. I’m hoping to seek these out when I can (as of 8/3/2025).
This chart was originally published on March 21, 2025 and has not been updated. I will consider seeking to update it when data for the entirety of 2025 become available (as of 8/3/2025).
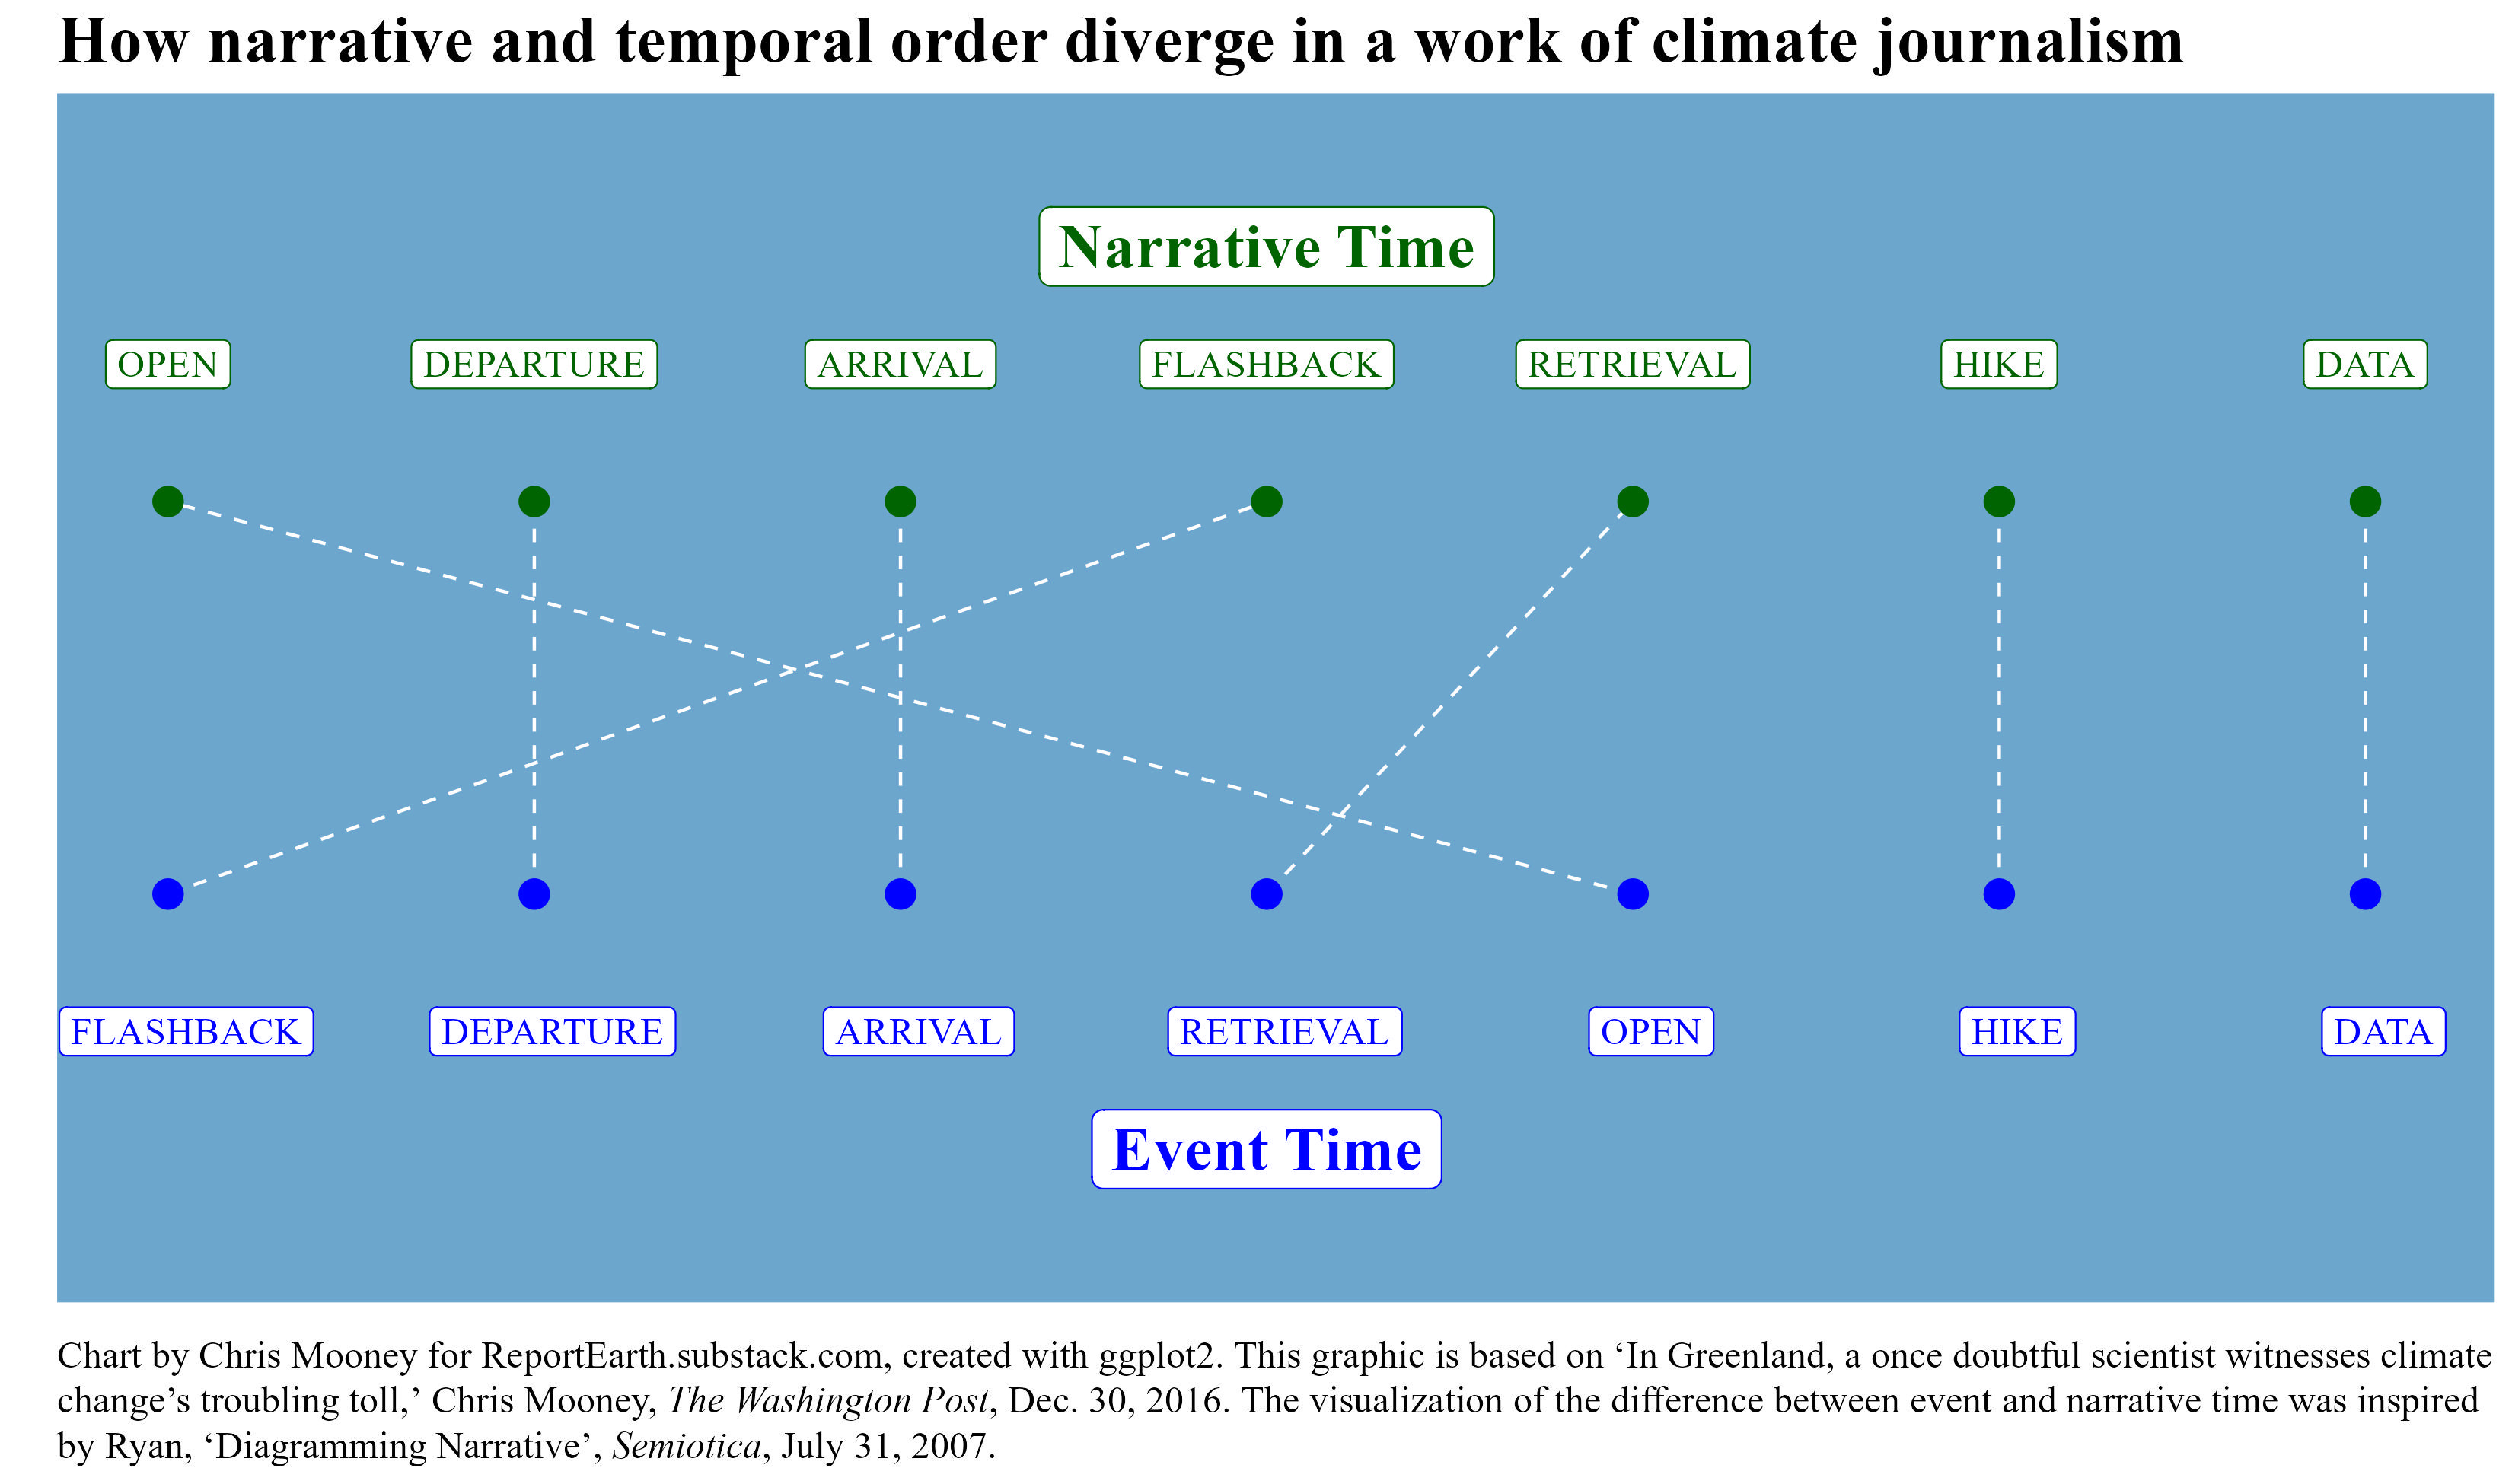
Story visualizations
This chart was originally published on 4/15/2026.
This chart was originally published on 4/15/2026. I’ll update it on my birthday, 2026.
This chart was originally published on 4/15/2026. There are no plans to update it, because what would that even mean?
This chart was originally published on 4/15/2026. It won’t be updated.
This chart was originally published on 4/15/2026.
US Temperatures
This chart was originally published on 8/23/2025. It is currently up to date (as of 8/23/2025).
This chart was originally published on 8/23/2025. It is currently up to date (as of 8/23/2025).
Water
This chart was originally published on May 31, 2025. Because it is based on data from a published scientific study, I do not plan to update it (as of 8/3/2025).
Wildfires
This chart was originally published June 11, 2025. It was last updated on 8/4/2025.